グラフの書式を変えて、見栄えを良くしたいですよね?
Pythonのmatplotlibでグラフのメモリラベルを装飾してみましょう。

参考にするmatplotlib.axes.Axes.plotのサイトを載せておきます。
matplotlib.axesのサイトも載せておきます。
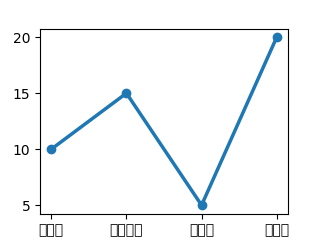
サンプルのグラフの作成
サンプルのグラフを用意します。
下記ページを参考に作成します。
import os
from datetime import datetime
import matplotlib.pyplot as plt

data = {'apple': 10, 'orange': 15, 'lemon': 5, 'lime': 20}
names = list(data.keys())
values = list(data.values())

fig, ax = plt.subplots(1, 1, figsize=(3.2, 2.4))
ax.plot(names, values, linewidth=2.5, marker='o')

filename = 'graph_plot_' + datetime.today().strftime('%Y%m%d') + '_a.png'
file_path = os.path.join(os.getcwd(), filename)
plt.savefig(file_path)
上記コードを実行すると、折れ線グラフが出力されます。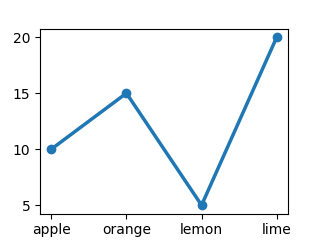
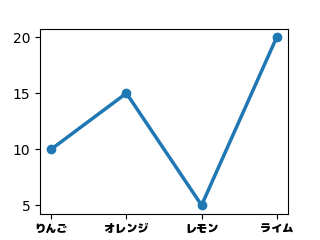
ラベルに日本語を使う
ax.set_xticklabels関数を使って、メモリのラベルを日本語にしてみます。
import os
from datetime import datetime
import matplotlib.pyplot as plt

data = {'apple': 10, 'orange': 15, 'lemon': 5, 'lime': 20}
names = list(data.keys())
values = list(data.values())

fig, ax = plt.subplots(1, 1, figsize=(3.2, 2.4))
ax.plot(names, values, linewidth=2.5, marker='o')

print(ax.get_xticklabels())
ax.set_xticklabels(['りんご', 'オレンジ', 'レモン', 'ライム'])
print(ax.get_xticklabels())

filename = 'graph_plot_' + datetime.today().strftime('%Y%m%d') + '_b.png'
file_path = os.path.join(os.getcwd(), filename)
plt.savefig(file_path)
Warningの対応
日本語うんぬんの前に、ax.set_xticklabels関数の実行時にWarningが出ています。
Warningは「UserWarning: FixedFormatter should only be used together with FixedLocator 」です。
UserWarning: FixedFormatter should only be used together with FixedLocator
原因を調べるために、set_xticklabels関数のサイトを見てみます。
Axes.set_xticklabels関数の使用は非推奨で、Axes.set_xticks関数を使うことを推奨されています。
The use of this method is discouraged, because of the dependency on tick positions. In most cases, you’ll want to use
Axes.set_[x/y/z]ticks(positions, labels)orAxes.set_xticksinstead.目盛り位置に依存するため、このメソッドの使用は推奨されません。ほとんどの場合、代わりにAxes.set_[x/y/z]ticks(positions, labels)またはAxes.set_xticksを使用します。
出典:matplotlib.axes.Axes.set_xticklabels
Warning対策として、以下の対応をします。
- set_xticklabels関数の代わりにset_xticks関数を使う。
- set_xticks関数の第一引数ticksにget_xticks関数で取得したtick locationsのリストを渡す。
Warning対応したコードがこちらです。
import os
from datetime import datetime
import matplotlib.pyplot as plt

data = {'apple': 10, 'orange': 15, 'lemon': 5, 'lime': 20}
names = list(data.keys())
values = list(data.values())

fig, ax = plt.subplots(1, 1, figsize=(3.2, 2.4))
ax.plot(names, values, linewidth=2.5, marker='o')

print(ax.get_xticklabels())
ax.set_xticks(ax.get_xticks(), ['りんご', 'オレンジ', 'レモン', 'ライム'])
print(ax.get_xticklabels())

filename = 'graph_plot_' + datetime.today().strftime('%Y%m%d') + '_c.png'
file_path = os.path.join(os.getcwd(), filename)
plt.savefig(file_path)
日本語が豆腐になる問題
ここで、日本語問題に出くわします。
plt.savefig関数実行時に、UserWarningが出て、出力されたグラフの文字が豆腐になっています。
日本語を持たないフォントのため、日本語を表示できないからです。
UserWarning: Glyph 12426 (\N{HIRAGANA LETTER RI}) missing from current font.
この豆腐問題を解決するために、fontpropertiesパラメータを使います。
ax.set_xticks関数の引数fontpropertiesで日本語を持つフォントを指定します。
コードの例では、MPLUSRounded1c-Black.ttf を指定しています。
文字はGoogleフォントなどからダウンロードしてください。
ttfファイルは、コードと同じディレクトリに置くか、パスを通してください。
import os
from datetime import datetime
import matplotlib.pyplot as plt
from matplotlib.font_manager import FontProperties

data = {'apple': 10, 'orange': 15, 'lemon': 5, 'lime': 20}
names = list(data.keys())
values = list(data.values())

fig, ax = plt.subplots(1, 1, figsize=(3.2, 2.4))
ax.plot(names, values, linewidth=2.5, marker='o')

fp = FontProperties(fname='MPLUSRounded1c-Black.ttf')

ax.set_xticks(
    ax.get_xticks(),
    ['りんご', 'オレンジ', 'レモン', 'ライム'],
    fontproperties=fp,
    fontsize=8,
    )

filename = 'graph_plot_' + datetime.today().strftime('%Y%m%d') + '_d.png'
file_path = os.path.join(os.getcwd(), filename)
plt.savefig(file_path)
上記コードを実行すると、日本語に対応したグラフが出力されます。
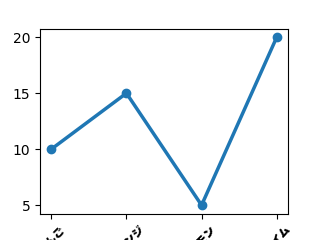
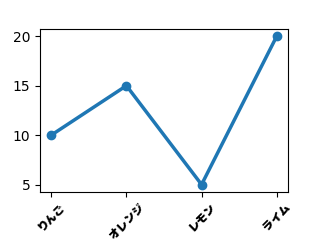
ラベルを回転させる
ラベルの回転と文字の位置
メモリラベルを回転させるのはrotationパラメータに設定します。
水平方向の文字の位置はhaパラメータで調整します。
haパラメータは、horizontal-alignmentのことです。
import os
from datetime import datetime
import matplotlib.pyplot as plt
from matplotlib.font_manager import FontProperties

data = {'apple': 10, 'orange': 15, 'lemon': 5, 'lime': 20}
names = list(data.keys())
values = list(data.values())

fig, ax = plt.subplots(1, 1, figsize=(3.2, 2.4))
ax.plot(names, values, linewidth=2.5, marker='o')

fp = FontProperties(fname='MPLUSRounded1c-Black.ttf')

ax.set_xticks(
    ax.get_xticks(),
    ['りんご', 'オレンジ', 'レモン', 'ライム'],
    fontproperties=fp,
    fontsize=8,
    rotation=45,
    ha="center",
    )

filename = 'graph_plot_' + datetime.today().strftime('%Y%m%d') + '_e.png'
file_path = os.path.join(os.getcwd(), filename)
plt.savefig(file_path)
上記コードだと、下の方が切れてしまっています。
グラフの余白の設定
グラフの周りの余白を調整するのは、subplots_adjust関数です。
import os
from datetime import datetime
import matplotlib.pyplot as plt
from matplotlib.font_manager import FontProperties

data = {'apple': 10, 'orange': 15, 'lemon': 5, 'lime': 20}
names = list(data.keys())
values = list(data.values())

fig, ax = plt.subplots(1, 1, figsize=(3.2, 2.4))
plt.subplots_adjust(bottom=0.2)
ax.plot(names, values, linewidth=2.5, marker='o')

fp = FontProperties(fname='MPLUSRounded1c-Black.ttf')

ax.set_xticks(
    ax.get_xticks(),
    ['りんご', 'オレンジ', 'レモン', 'ライム'],
    fontproperties=fp,
    fontsize=8,
    rotation=45,
    ha="center",
    )

filename = 'graph_plot_' + datetime.today().strftime('%Y%m%d') + '_f.png'
file_path = os.path.join(os.getcwd(), filename)
plt.savefig(file_path)
上記コードでこうなりました。
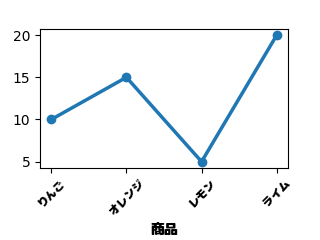
X軸のタイトルを入れる
set_xlabel関数でX軸のタイトルを付けることができます。
import os
from datetime import datetime
import matplotlib.pyplot as plt
from matplotlib.font_manager import FontProperties

data = {'apple': 10, 'orange': 15, 'lemon': 5, 'lime': 20}
names = list(data.keys())
values = list(data.values())

fig, ax = plt.subplots(1, 1, figsize=(3.2, 2.4))
plt.subplots_adjust(bottom=0.3)
ax.plot(names, values, linewidth=2.5, marker='o')

fp = FontProperties(fname='MPLUSRounded1c-Black.ttf')

ax.set_xticks(
    ax.get_xticks(),
    ['りんご', 'オレンジ', 'レモン', 'ライム'],
    fontproperties=fp,
    fontsize=8,
    rotation=45,
    ha="center",
    )
ax.set_xlabel('商品', fontproperties=fp)

filename = 'graph_plot_' + datetime.today().strftime('%Y%m%d') + '_g.png'
file_path = os.path.join(os.getcwd(), filename)
plt.savefig(file_path)
上記コードでこうなりました。