ある結果に対して2種類のパラメータの影響度合いを視覚化するために、2次元ヒートマップを作成することがあると思います。やってみました。
正規分布する乱数
ヒートマップに使う値を生成します。2次元ヒートマップなので、中央が濃くなるように正規分布する乱数を使います。
https://numpy.org/doc/stable/reference/random/generated/numpy.random.normal.html
# 正規分布する乱数の作成
values = np.random.normal(loc=0.0, scale=1.0, size=1000)

# ヒストグラムにして、正規分布を確認する。
fig = plt.figure()
ax = fig.add_subplot()
ax.hist(values, bins=100, alpha=0.8)
ax.grid(axis='both', linestyle='--')
plt.show()
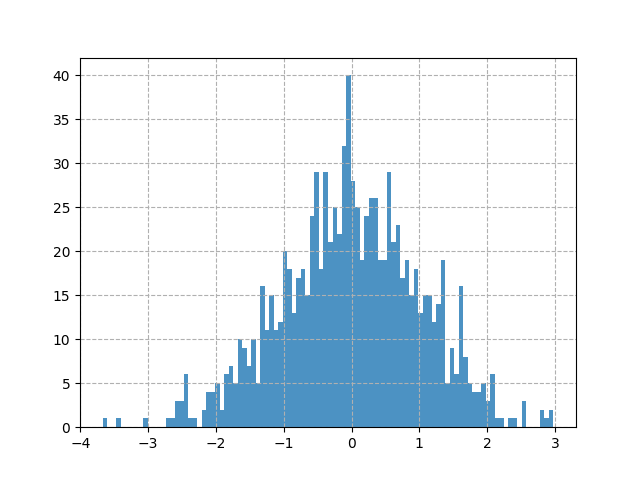
生成した値が正規分布になっているか確認するためにヒストグラムにしています。以下のようになりました。

2次元ヒートマップを描く
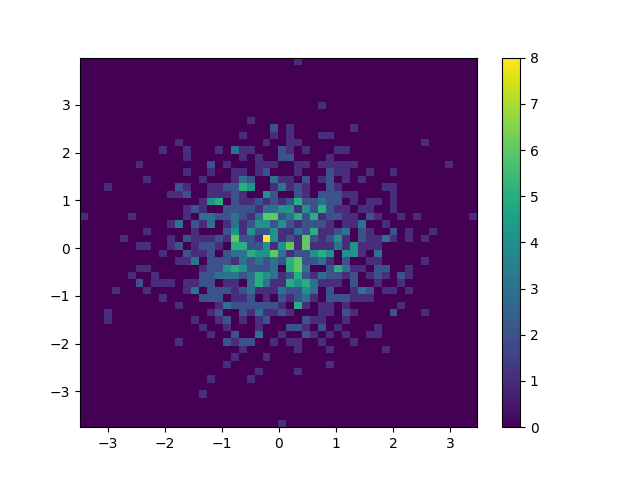
正規分布する値をX軸とY軸に分布させ、121ax.hist2d関数を使って2次元ヒートマップを描きます。
https://matplotlib.org/stable/api/_as_gen/matplotlib.axes.Axes.hist2d.html
# X軸とY軸の値を用意する。
x = np.random.normal(loc=0.0, scale=1.0, size=1000)
y = np.random.normal(loc=0.0, scale=1.0, size=1000)

# 2次元ヒートマップを作成する。
fig = plt.figure()
ax = fig.add_subplot()
h = ax.hist2d(x, y, bins=50)
fig.colorbar(h[3], ax=ax)
plt.show()

カラーマップを適用する
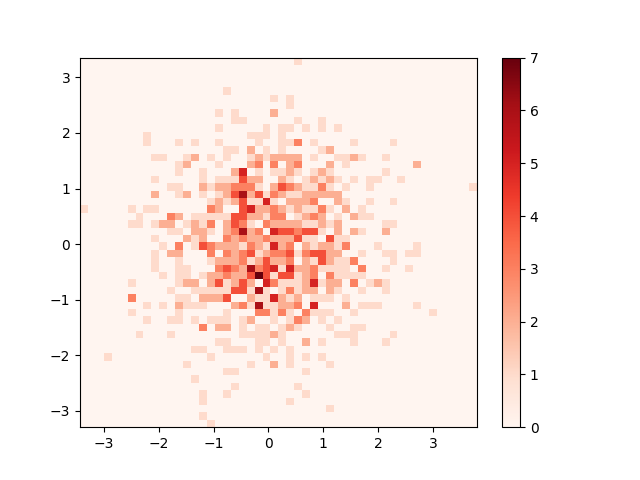
色使いがデフォルトだと分かりづらい場合はカラーマップを使いましょう。カラーマップの”Reds”を使うサンプルコードです。
# X軸とY軸の値を用意する。
x = np.random.normal(loc=0.0, scale=1.0, size=1000)
y = np.random.normal(loc=0.0, scale=1.0, size=1000)

# 2次元ヒートマップを作成する。
fig = plt.figure()
ax = fig.add_subplot()
h = ax.hist2d(x, y, bins=50, cmap=matplotlib.cm.Reds)
fig.colorbar(h[3], ax=ax)
plt.show()

カラーマップはいろいろあるので、お好みのものを選んでください。
https://matplotlib.org/stable/users/explain/colors/colormaps.html
出典: matplotlib.org
