Pythonでグラフを描くときに、グラフ上にテキストを書くことがあると思います。そのテキストの位置を動かしてみたいと思います。
ax.text()関数を使います。
https://matplotlib.org/stable/api/_as_gen/matplotlib.axes.Axes.text.html
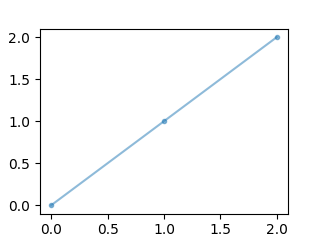
テキストを描画するグラフは(x, y)=[(0, 0), (1, 1), (2, 2)]の3点を結ぶ直線のグラフとしました。
import matplotlib.pyplot as plt

# テキストを描画するベースのグラフの作成
fig = plt.figure(figsize=(3.2, 2.4))
ax = fig.add_subplot()
ax.plot([0, 1, 2], [0, 1, 2], marker='.', alpha=0.5)
plt.show()
matplotlibのax.text()でテキストを描画する
データ座標系
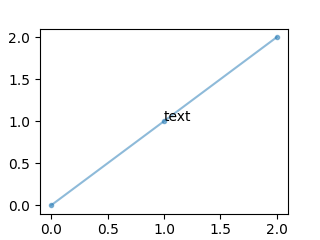
座標(1, 1)にテキストを描画する例です。デフォルトだと描画位置はデータ座標系となるので、X軸とY軸の数値から(1, 1)のポイントにテキストが描画されます。今回の例だと真ん中あたりに描画されます。
import matplotlib.pyplot as plt

fig = plt.figure(figsize=(3.2, 2.4))
ax = fig.add_subplot()
ax.plot([0, 1, 2], [0, 1, 2], marker='.', alpha=0.5)
# デフォルトだとx,yはデータ座標となる。
ax.text(1, 1, 'text')
plt.show()
軸座標系(transformパラメータを使う)
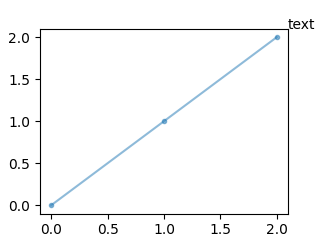
transformパラメータにax.transAxesを指定して、テキスト描画位置を軸座標系にします。軸座標系にすると、グラフの左下が(0, 0)で右上が(1, 1)の座標系になります。下記コードだとグラフ右上の位置に描画されます。
fig = plt.figure(figsize=(3.2, 2.4))
ax = fig.add_subplot()
ax.plot([0, 1, 2], [0, 1, 2], marker='.', alpha=0.5)
# transformパラメータを使ってx,yを軸座標系にする。
ax.text(1, 1, 'text', transform=ax.transAxes)
plt.show()
位置を調整する
水平・垂直アライメントを使う
テキスト描画位置は設定できるようになりましたが、グラフと被らせないように位置を調整したくなることがあります。そのときは水平アライメント(horizontalalignment, ha)と垂直アライメント(verticalalignment, va)を使いましょう。
| ha | left, center, right |
| va | baseline, bottom, center, center_baseline, top |
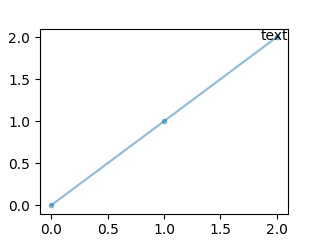
グラフ右上の内側に描画したいときは、(x, y)=(1, 1)、ha=’right’、va=’top’と設定します。
fig = plt.figure(figsize=(3.2, 2.4))
ax = fig.add_subplot()
ax.plot([0, 1, 2], [0, 1, 2], marker='.', alpha=0.5)
# 座標x,yに対する水平・垂直アライメントを設定する。
ax.text(1, 1, 'text', transform=ax.transAxes, ha='right', va='top')
plt.show()
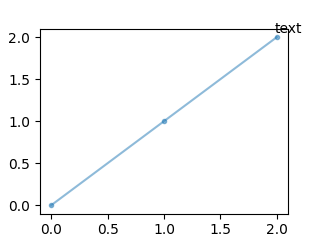
ha=’center’、va=’center’と設定すると、こうなります。
fig = plt.figure(figsize=(3.2, 2.4))
ax = fig.add_subplot()
ax.plot([0, 1, 2], [0, 1, 2], marker='.', alpha=0.5)
# 座標x,yに対する水平・垂直アライメントを設定する。
ax.text(1, 1, 'text', transform=ax.transAxes, ha='center', va='center')
plt.show()
描画位置を少数やマイナスにする
描画位置の設定を少数にして微調整したり、マイナス設定にしたりすることも可能です。
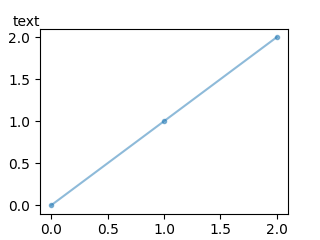
例えば、グラフ左上の外側にテキストを描画する例です。
# グラフの左上の外側にテキストを描画する場合
fig = plt.figure(figsize=(3.2, 2.4))
ax = fig.add_subplot()
ax.plot([0, 1, 2], [0, 1, 2], marker='.', alpha=0.5)
ax.text(0, 1, 'text', transform=ax.transAxes, ha='right', va='bottom')
plt.show()
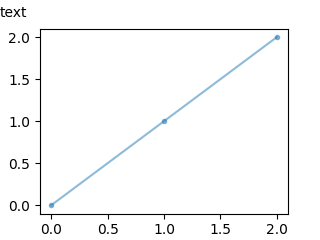
これをもうちょっと離れた外側に描画する場合、マイナスや少数を使って微調整できます。
# グラフの左上の外側のちょっと離れた位置にテキストを描画する場合
fig = plt.figure(figsize=(3.2, 2.4))
ax = fig.add_subplot()
ax.plot([0, 1, 2], [0, 1, 2], marker='.', alpha=0.5)
ax.text(-0.05, 1.05, 'text', transform=ax.transAxes, ha='right', va='bottom')
plt.show()
その他
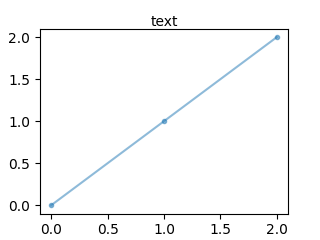
グラフ上部の真ん中にテキストを描画する例
# グラフの上部真ん中にテキストを描画する場合
fig = plt.figure(figsize=(3.2, 2.4))
ax = fig.add_subplot()
ax.plot([0, 1, 2], [0, 1, 2], marker='.', alpha=0.5)
ax.text(0.5, 1.0, 'text', transform=ax.transAxes, ha='center', va='bottom')
plt.show()
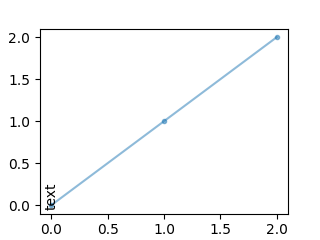
グラフ左下に90度回転させたテキストを描画する例
# グラフの左下に90度回転させたテキストを描画する場合
fig = plt.figure(figsize=(3.2, 2.4))
ax = fig.add_subplot()
ax.plot([0, 1, 2], [0, 1, 2], marker='.', alpha=0.5)
ax.text(0.02, 0.02, 'text', transform=ax.transAxes, ha='left', va='bottom', rotation=90)
plt.show()
