お困りの方へ
時系列データはよく使うので、日付がindexのDataFrameを作りたいですよね。
この記事で簡単なサンプルコードをお見せします。
前準備
サンプルコードでimportするモジュールです。
import pandas as pd
import numpy as np
import random
import matplotlib.pyplot as plt
日付のリストを作成する
pandasのdate_rangeを使って、日付のリストを作ります。
3日分の日付リストを作ります。
freqを変えれば、日付の間隔を変えることもできます。
date_index = pd.date_range(
    start='2024-08-21',
    end='2024-08-23',
    freq='D',
    )

print(date_index)
# atetimeIndex(['2024-08-21', '2024-08-22', '2024-08-23'], dtype='datetime64[ns]', freq='D')

for d in date_index:
    print(d)
# 2024-08-21 00:00:00
# 2024-08-22 00:00:00
# 2024-08-23 00:00:00
日付がindexのDataFrameを作成する
引数indexに日付リストを渡して、DataFrameを作成すれば完了です。
初期値を入れておきたい方は、引数dataと引数columnsにも値を入れましょう。
df = pd.DataFrame(
    index=date_index,
    )

print(df)
# Empty DataFrame
# Columns: []
# Index: [2024-08-21 00:00:00, 2024-08-22 00:00:00, 2024-08-23 00:00:00]
# 日付がindexのDataFrameが作成された。

df = pd.DataFrame(
    data=np.zeros(len(date_index)),
    index=date_index,
    columns=['samples'],
    )

print(df)
#             samples
# 2024-08-21      0.0
# 2024-08-22      0.0
# 2024-08-23      0.0
# DataFrame作成時に初期値を入れる。

print(df.index[0])
print(type(df.index[0]))
# 2024-08-21 00:00:00
# <class 'pandas._libs.tslibs.timestamps.Timestamp'>
# indexはTimestamp型。
DataFrameに値を代入する
samplesカラムに適当な値を代入します。
for i in range(len(df)):
# samples列に適当な整数を代入する。
df.iat[i, df.columns.get_loc('samples')] = random.randint(1, 10)
print(df)
# samples
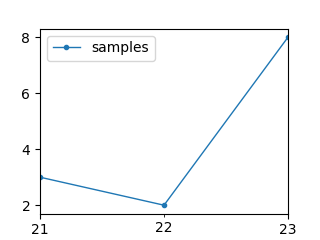
# 2024-08-21 3.0
# 2024-08-22 2.0
# 2024-08-23 8.0
DataFrameをグラフにする
作成したDataFrameをグラフにします。
fig, ax = plt.subplots(1, 1, figsize=(3.2, 2.4))

df['samples'].plot(
    ax=ax,
    linewidth=1,
    marker='.',
    label='samples',
    )

ax.legend() # 凡例の表示
plt.show()